Did you know that you can use Facebook Analytics Funnels to help uncover the value of an action on Facebook? You can, and it’s pretty amazing.
You probably noticed that I’m on a big Facebook Analytics kick lately. Andrew wrote about 3 Benefits of Facebook Analytics a couple of weeks ago, and I wrote about Facebook Analytics, the Pixel, and Events. That, of course, coincided with a Facebook Analytics Master Class that happened last week (you can still sign up for the recordings).
Why the focus on Facebook Analytics? Because it’s a great tool that no one is using. And I was one of those people until earlier this year. Now that I see what you can do with Facebook Analytics, I’m hooked. One of the main reasons for this new focus: Facebook Analytics Funnels.
Thanks to Facebook Analytics Funnels, I’ve found that the most valuable actions someone can take on my Facebook page are messages sent, “love” reactions, and post comments. This post explores how I uncovered this information, and how you can better understand your own funnel.
Set Up Event Source Groups
To get the most out of Facebook Analytics Funnels, let’s first make sure you have everything set up properly in Facebook Analytics.
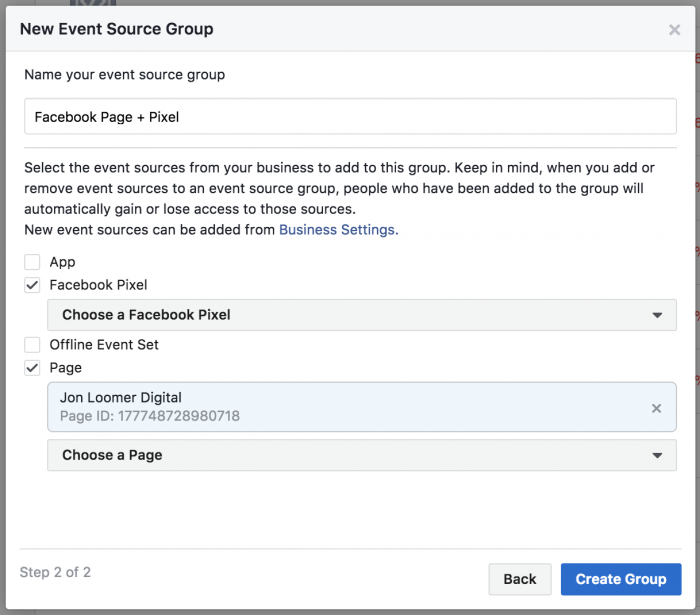
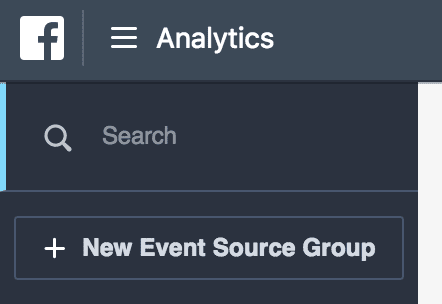
Go to Facebook Analytics and set up your Event Source Group at the top left.
Select event sources for your business. Personally, I select my Facebook page and pixel.
By doing this, Facebook can track a single user across Facebook (page, posts, and Messenger) and my website.
Facebook Analytics Funnels and Pixel Events
Before we move forward, understand that the quality of information you can get in Facebook Analytics depends upon your usage of Facebook Events. You use Events to tell Facebook when a purchase, lead, registration, or other conversion happens — as well as the details of that conversion (value, quantity, product).
If you need help with this, read my post for details.
Create Your First Funnel
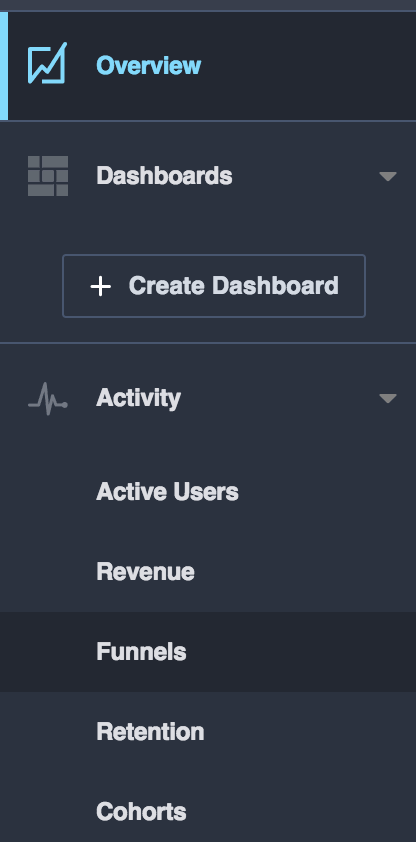
Click on “Funnels” under Activity on the left…
If you haven’t created Facebook Analytics Funnels before, it will look like this…
Click “Create Funnel.”
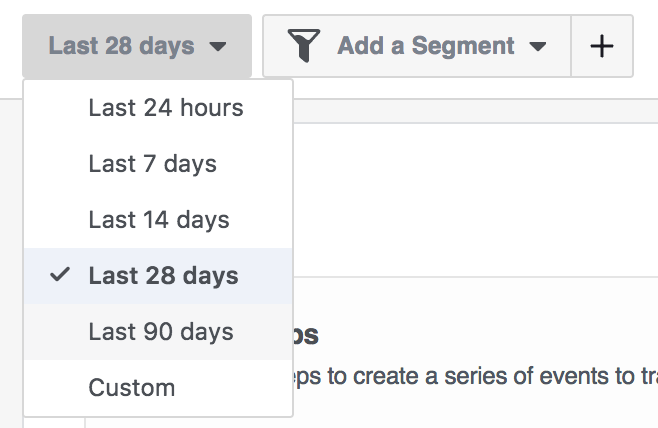
I recommend you expand the time window at the top left to increase the sample size to provide meaningful results. Consider using “last 90 days” or a custom time period.
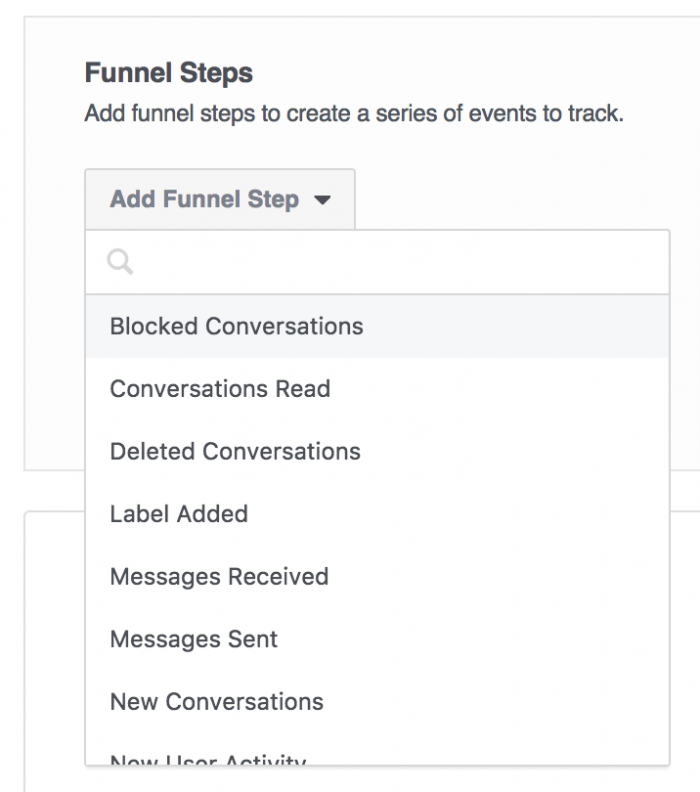
Now you need to add your first funnel step. This will be the top of the funnel — the first action that someone performs.
The options that appear here will depend upon what source groups you added and the Events that have been registered. Following are the options that appear for me:
- New User Activity (Any)
- User Activity (Any)
- Comments (Page Posts)
- Shares (Page Posts)
- Reactions (Page Posts)
- Bocked Conversations (Messenger)
- Conversations Read (Messenger)
- Deleted Conversations (Messenger)
- Label Added (Messenger)
- Messages Received (Messenger)
- Messages Sent (Messenger)
- New Conversations (Messenger)
- Add to Cart (Pixel)
- Complete Registration (Pixel)
- Content View (Pixel)
- Page Views (Pixel)
- Purchases (Pixel)
- Search (Pixel)
- Sessions (Pixel)
You’ll need to add multiple funnel steps (at least two)…
You can edit a funnel step to add more detail.
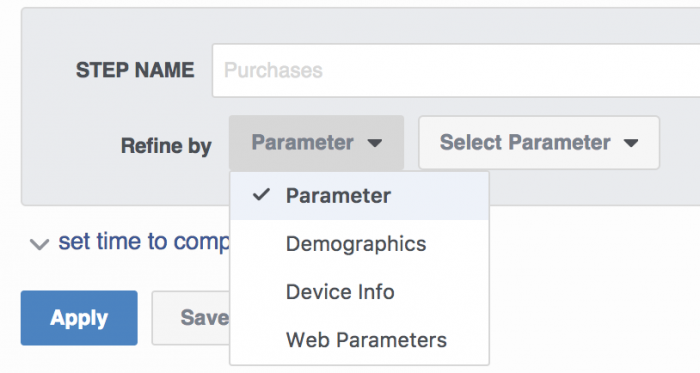
Refine by parameter, demographics, device info, or web parameters…
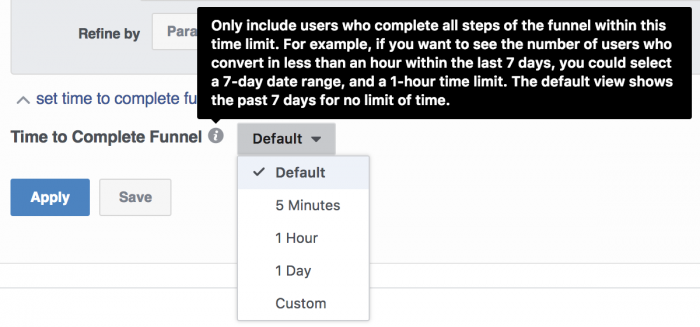
You can also set a time to complete the funnel. If you use this, only those who complete the funnel in the designated time will appear in your results.
As you can see, the options are virtually unlimited regarding the funnels you can create. So let’s focus on funnels that 1. start with an action on Facebook (reaction, post comment, post share, or message) and 2. end with an action on my website (page view, registration, or purchase).
Post Reaction to Page View
First, let’s get an idea of what post reaction is most likely to result in a page view on my website. For example, are likes an empty reaction? Might people like without clicking the link? Are negative reactions less likely to result in a click?
Let’s get a baseline by creating a funnel of all post reactions to a page view…
In the example above, about 46% of those who like a post end up viewing a page on my website. That means that more than half of all reactions aren’t leading to a click or page view. And the median amount of time to then view a page on my website is 1.1 weeks. In other words, it’s not in immediate reaction to the post they saw.
But maybe this comes out differently based on the reaction.
The information available by reaction isn’t significant for “angry” (11 people), “haha” (53), or “sad” (11) due to sample size. But if you’re interested, here is the breakdown of page views by reaction:
- Angry: 36%
- Haha: 30%
- Sad: 64%
“Wow” reactions were used a bit more (175 people) and they resulted in a page view 53% of the time.
“Like” reactions are most common (13,000 people), not surprisingly. However, a “like” doesn’t necessarily mean a user is more likely to view a page of my website. About 46% of likes result in a page view.
“Love” reactions provide the most interesting results. There are 709 people who “loved” a post, so that’s a decent sample size. Of those who “loved” a post, more than 61% viewed a page of my website.
Post Reaction to Registration
As you might imagine, sample size will become a bigger issue when we move from page views to registrations. At the same time, there is enough data to learn something here.
Of the 13,000 total people who offered a post reaction, 1,000 (7.7%) would result in a registration on my website.
Understand that most page posts are not promotional. They are most often links to blog posts. So this conversion percentage doesn’t reflect a direct conversion rate for the promotion of an opt-in. Instead, it reflects the likelihood that someone will register eventually for something if they provide a post reaction.
None of the 11 people who shared “angry” reactions would register on my website. That’s not a big surprise, but it’s interesting to get that confirmation.
Two of the 11 “sad” people would register. While that’s a nifty 18.18%, I wouldn’t consider the results to be significant due to sample size.
Only 1 of the 53 “haha” reactions resulted in a registration (1.89%). Small sample size, but still rather significant. The “haha” is not productive.
A total of 13 of the 175 “wow” reactions (7.43%) resulted in a registration. Now we’re getting somewhere.
Of the 13,000 post likes, 971 (7.63%) would result in a registration. I’d consider that significant!
How about “love”? Once again, it’s the top performer. This time, 68 of the 709 people (9.6%) who “loved” a post ended up registering on my website. Feel the love!
Post Reaction to Purchase
Sample size becomes a bigger issue when we measure post reaction to purchase, but let’s take a look and see what we can make of it.
Of the 13,000 people who reacted to a post on my Facebook page, 86 of them (.65%) resulted in a purchase. Once again, this isn’t a conversion rate for promoting product since I disproportionately promote content. However, it gives you an idea of how many of those who react ultimately buy from me after the fact.
No sales came from the 22 combined “angry” and “sad” reactions.
The “haha” reaction resulted in a single sale (likely the same person who registered).
“Wow” was productive as sales resulted 1.71% of the time. However, with total sales of 3, one or two sales here or there significantly impacts the results.
The “like” reaction was most common, and it resulted in 83 sales (.65%).
Finally, the 709 “love” reactions resulted in 7 sales (.99%). Somewhat more significant than “wow” due to sample size. Consistently more valuable than “like.”
Facebook Analytics Funnels: Post Comments
Now that we have an understanding of the impact of post reactions on website actions, let’s take a look at some other options for the top of our funnel. First, let’s look at how often a post comment results in a page view, registration, and purchase.
There were about 2,000 people who commented on one of my page posts. About 58% of them would then view a page on my website. You may recall that the “love” reaction resulted in a view 61% of the time.
A post comment resulted in a registration 7.81% of the time. This is consistent with the value of a post like (7.63%).
Finally, 1.07% of post comments resulted in a purchase. This is the most significant result of a comment as it surpasses both the “like” and “love.”
Facebook Analytics Funnels: Post Shares
There were about 2,000 people who shared one of my blog posts. Let’s take a look at the likelihood of these people to view a page, register, or purchase…
- Page View: 50.08%
- Register: 8.71%
- Purchase: .55%
I find this surprising. While a post share is valuable because it results in more people seeing it, this action doesn’t make the person sharing the post any more likely to ultimately view a page, register, or purchase.
Of the three, only the registration happens at a higher rate than post comments. Meanwhile, the post “love” outperforms shares in all phases.
Facebook Analytics Funnels: Messages Sent
One more, okay? I’m curious if those who send me a private message are more likely to perform these actions. There were a total of about 4,000 people to do so.
Here’s how they break down:
- Page View: 62.17%
- Register: 5.98%
- Purchase: 1.31%
Here, those who send me messages are very likely to view a page of my website and purchase, at least compared to all other actions. For whatever reason, they aren’t more likely to register.
It’s possible that this is at least partially attributable to staff being likely to refer people messaging us to either a blog post or a product.
Now What?
We could do this all day, right? So, what can we do with this information?
Well, here’s a breakdown of the top performers by website action…
Page View:
- Messages Sent (62.17%)
- LOVE (61.07%)
- Post Comments (58.44%)
Registration:
- LOVE (9.59%)
- Post Shares (8.71%)
- Post Comments (7.81%)
Purchase:
- Messages Sent (1.31%)
- Post Comments (1.07%)
- LOVE (.99%)
Based on this data, it would appear the most valuable Facebook actions for me would be messages sent, post comments, and the “love” reaction. It provides perspective on the value of the activity I’m getting on my Facebook page. I should value messages sent, post comments, and “love” over others.
We could actually take it a step further and start assigning a value to each action. I know that there have been more than 3,700 total comments on a post during the evaluated time period, leading to 82 purchases for $13,200. We could then roughly value a post comment at $3.56.
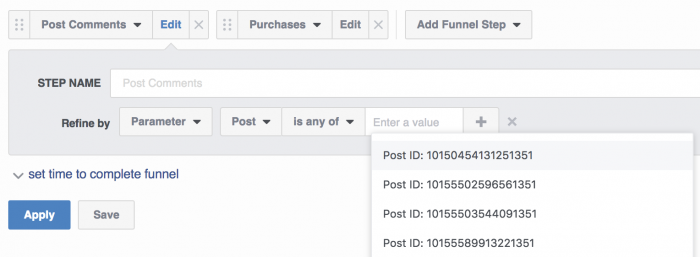
These examples are just scratching the surface. I encourage you to build your own funnels. If you have the volume, you can even filter post comments, shares, and reactions by the actual post…
Metric Benchmarks
I know what one of the first questions I’m going to get on this: “What benchmarks should I use for my funnels?”
Be careful here. There is a long list of factors that contribute to the numbers I’m getting here. Type of content I share, quality of audience, advertising, level of focus on conversions, email funnels, industry, audience overlap between Facebook and my website, and a whole lot more.
My numbers are neither good nor bad. They are simply my numbers and should be taken in context with everything I’m doing. You should do the same with your own numbers.
Your Turn
What was intended to be a simple blog post became complicated in a hurry. The bottom line is that you can uncover some valuable information within Facebook Analytics Funnels. You just have to be willing to dig!
What types of funnels are you creating within Facebook Analytics? What surprising results are you finding?
Let me know in the comments below!
The post Facebook Analytics Funnels: Value of Reactions and Page Actions appeared first on Jon Loomer Digital.
