
What Are Facebook Event Source Groups?
An event source group is a group of events in Facebook Analytics, where an event is an action that a user takes and Facebook gathers through one of its platforms.
With event source groups, you can set up event tracking on multiple channels through Facebook. This will allow you to better track and understand user interaction with your brand across multiple sources, and really hone your marketing and sales ROI using all of the data Facebook is pulling in.
An event could be a like, page view, message received, reply to a conversation, or even an Add to Cart action on your site (if you’ve installed the Facebook pixel). Events are gathered through Messenger, Facebook, Instagram, ad accounts, and pixels you’ve installed on your website or apps to track users. This can also include Facebook live chats installed on your website.
Grouping events can give you a better understanding of user flow and how your channels interlink. If you’re using Facebook ads alongside organic content, you can see how everything fits together and whether there’s overlap in audiences across channels.
Essentially, event source groups allow you to look at omnichannel interactions and analytics for free. Omnichannel analytics is something developers talk about all the time, but it’s also great for anyone interacting with their customers on multiple platforms on or outside of Facebook. You can also track offline data such as in-store purchases and link those to your social media campaigns.
You might be thinking that Google Analytics can already do this for you, and it can to a certain extent. The difference with event source groups in Facebook is that they allow you to measure page and post interactions alongside other behaviors, which Google Analytics can’t do.
Note: To use event source groups, you need to have a Facebook Business Manager account. It’s free, and I recommend setting it up anyway. If you’re managing multiple pages and ad accounts on Facebook, Business Manager can help streamline your efforts.
#1: Set Up Event Source Groups With Facebook Analytics
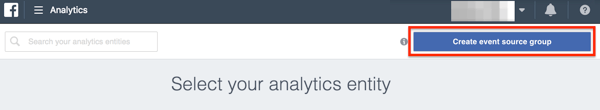
Setting up an event source group is easy. Open your Facebook Analytics and click Create Event Source Group in the top-right corner. You’ll be prompted to select a Business Manager account to associate with this group.
In the pop-up box that appears, name your event source group. As with anything in Facebook for business, choose something that’s easily identifiable. For instance, name this group after the business you’re tracking through multiple channels or a theme if you’re tracking a certain vertical (and have multiple pages).
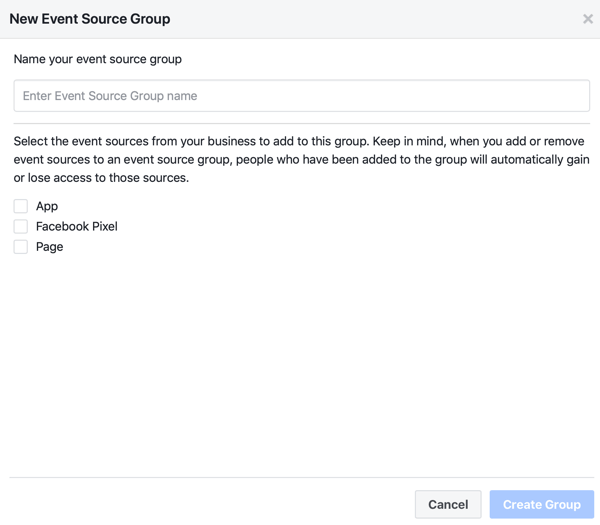
Also, decide whether you want to add an app, pixel, and page to the group. You can choose multiples of each one. When you’re done, click Create Group.
Remember, Facebook Messenger bots are considered apps too, so if you’ve set them up for your business, you’ll find them under the App option.
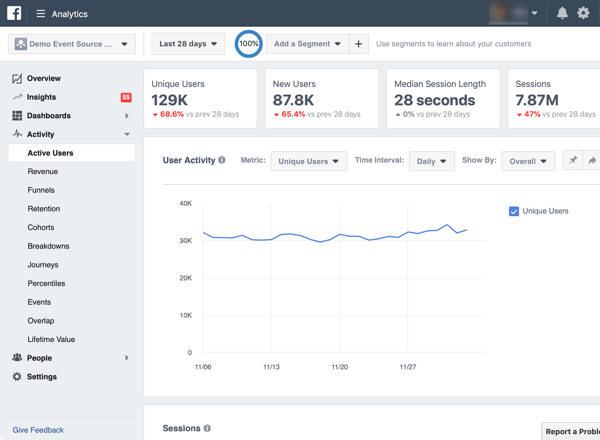
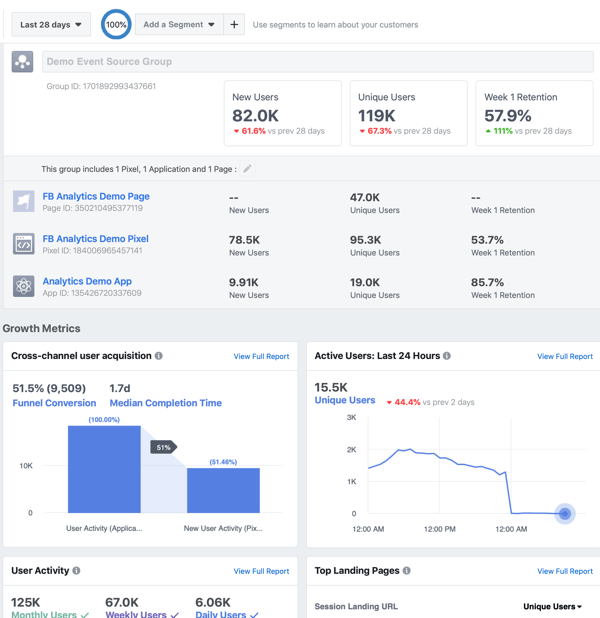
Once you’ve created an event source group, you can drill down into date ranges and segments. You can look at new users versus old users, retention, user activity, and more.
The bigger the audience that interacts with you online, the more you can drill down into this data and generate segments and audiences. The really useful part of event source groups is they’ll allow you to measure completion rates—however you define that—rather than just link clicks or post reactions for both your paid and organic campaigns.
We all know that page likes don’t mean anything as a KPI, but if you know exactly how many users liked a post, then viewed a page, and then downloaded an app, you can assign an actual value to a marketing campaign.
Facebook Analytics can also tell you how long this process took, which gives you a good idea of the sales cycle time for your product or service. Why is this important? In Ads Manager, a view to conversion generally has an attribution window of 1 (default), 7, or 28 days. If your sales cycle is 38 days, Ads Manager won’t pick up that people from your ads have converted on your site. Only your event source groups can do that.
#2: Analyze Audience Segment Data
Segments are a fast and easy way to separate various behaviors and demographics within your audiences when you want to look at data on a granular level.
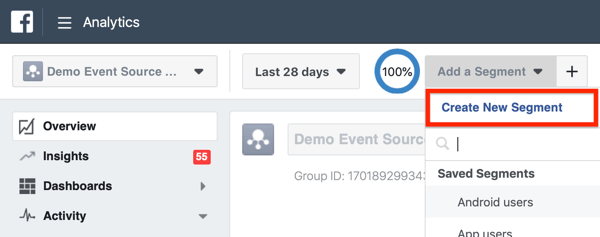
Creating a new segment within Facebook Analytics is easy. Click Add a Segment and select Create New Segment from the drop-down menu.
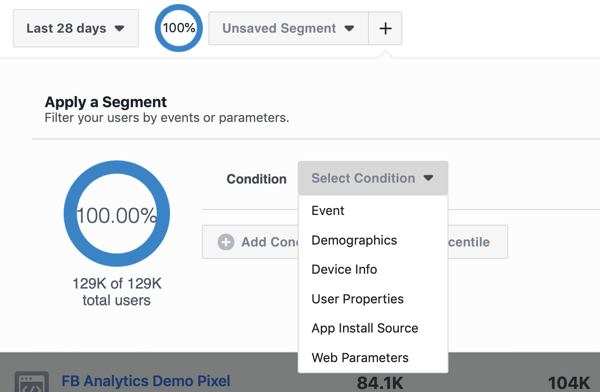
Then choose a Condition. A condition can be an event, demographic, user property, device, app install source, or web parameter. It’s essentially how you want to segment the data.
For example, if you want to see the number of people who interact with your brand from social media sources on desktop devices, you could select these settings: Device Info, Device Type, Is Any Of, and Computer.
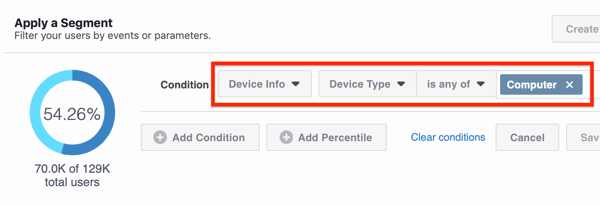
Once you select a segment, the pie chart will automatically adjust, showing you the percentage of users who meet this criterion. Click Save if you want to use this segment later or click Apply to only use this segment now.
Suppose that the results of this segment show that 37% of users are on desktop. This info would be incredibly useful if you’re running mobile ads exclusively; perhaps you didn’t realize that as much as 37% of your audience across channels is on desktop. Or if you have a site that works best on desktop, the fact that 63% of your users aren’t on desktop could push you to get more mobile-friendly.
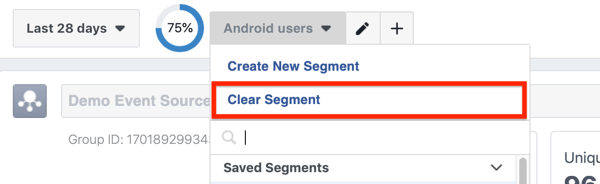
Remember that this segment follows you around from tab to tab in Facebook Analytics so don’t forget to clear the segment when you’re done to reset your audience. Simply open the Segment drop-down menu again and click Clear Segment.
#3: Perform Omnichannel Lead Attribution Analysis
Event source groups are great if you want to find out if your paid and organic marketing is working, and how this translates across channels for your business. If you have a Facebook ad account, page, and pixel installed, this will help you follow users down the sales funnel through various events.
Facebook generally offers last-touch attribution (recording only users who saw your ad and immediately converted) as a data point in ads. We know this isn’t always the whole picture. Sometimes people will see your ad, ruminate for a few days, and finally Google you and convert. Technically, they’re an organic search lead but in reality, they started as a paid social media lead. These people are lost to the Ads Manager reports.
You can see these first-touch conversions or attributions when you use multichannel analytics. Event source groups allow you to view these conversions and better understand how your ads are influencing actions on your page or website.
To illustrate, it might appear that your Facebook Reach campaign isn’t converting a single customer, but with closer inspection in Facebook Analytics using event source groups, you see that 5% of users who interact with your ads go on to like your posts before eventually filling out a contact form on your website. This data is available on the Funnels tab in Facebook Analytics.
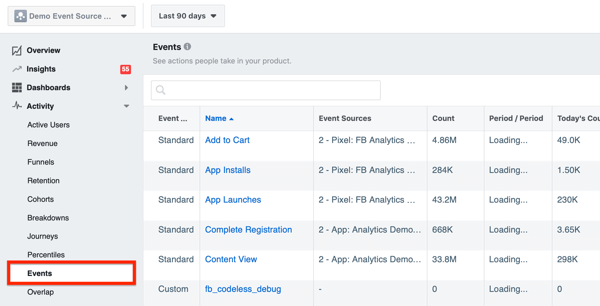
While your Reach campaign shouldn’t necessarily be leading to contacts (make sure you use a Reach campaign to generate an audience for an Engagement campaign that feeds into a Conversion campaign), you can see that it is. If you’ve set up custom events in your Facebook pixel correctly, you’ll be able to see how valuable these contacts are too. Here’s what the Events tab looks like in Facebook Analytics:
#4: Reveal Customer Journey Behaviors
Funnels are super-interesting and useful. They let you drill down into how people flow through your sales and marketing funnel using event source groups. This helps you justify budget on social and make sure you’re hitting people at every stage of the buyer journey.
If you’re not sure which funnels to set up initially, take a look at the Cross-Channel User Acquisition module in the Overview.
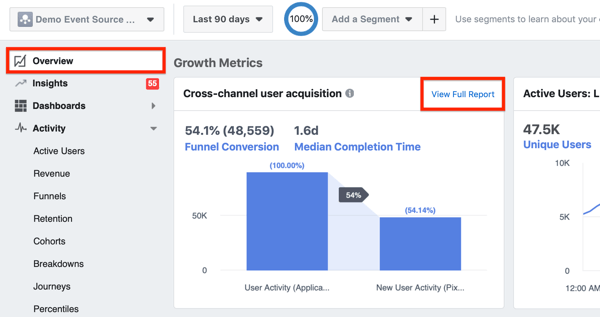
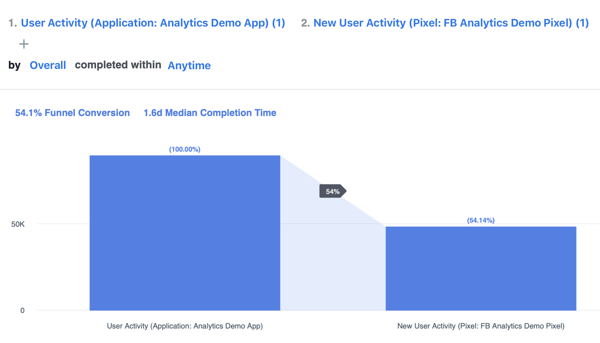
When you click on View Full Report, it will generate a funnel based on this module.
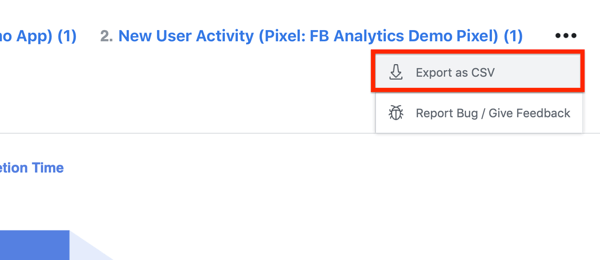
If you click the ellipsis icon on the right, you can export any funnel data as a CSV.
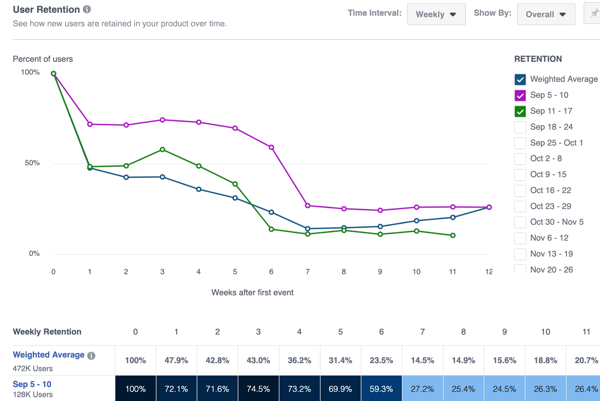
#5: Assess User Retention
Event source groups have a role in analyzing user retention and how well your content marketing is performing. On the Retention tab in Facebook Analytics, you can look at the percentage of users retained by your content over a period of time. This is especially useful for making data-driven decisions.
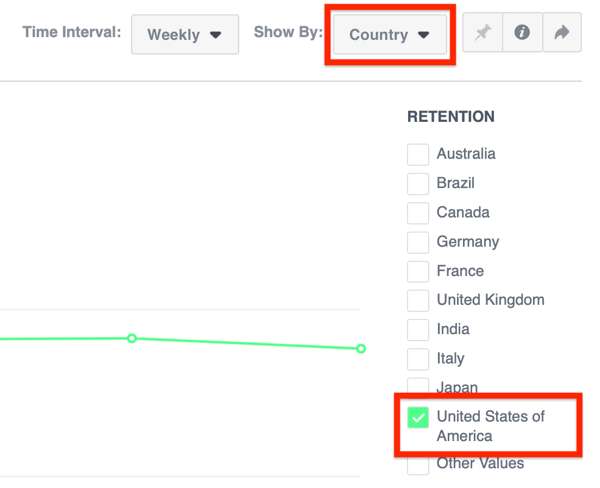
The Retention tab would let you segment your location to the U.S., for instance, and investigate whether your Cyber Monday deals brought in and retained customers of a high value over the last week. The data you gather can help you decide how much to spend on future Cyber Monday ad campaigns and determine whether your holiday shopper audience has a high lifetime value compared to your non-holiday audience.
#6: Use Percentiles to Inform Future Marketing Initiatives
On the Percentiles tab, you’ll get some actionable insights into your brand and various events. I love using this function.
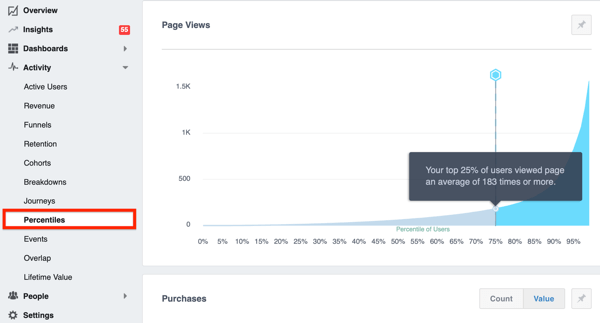
Suppose the Percentiles tab reveals that 75% of users read Messenger conversations from your business. With this data, you can be fairly confident users will read a message in the future.
If this stat were 30%, on the other hand, you’d want to reassess what you’re doing and make adjustments if needed. Maybe your Messenger bot is skewing this stat or perhaps you’re messaging too often. Something needs to change.
Conclusion
Event source groups may sound complicated but they’re actually easy to set up. Once they’re in place, you’ll find your Facebook Analytics are supercharged with useful data and you’ll be better able to justify marketing and sales budgets.
They’re also great if you have multiple Facebook pages, particularly Facebook location pages, because they allow you to look at how well your content resonates in different locations. Perhaps you’re pushing into a new location (city or country) and want to look at how people are interacting with your content, as well as how many new people are interacting with your brand from that location.
What do you think? Do you use event source groups for your business? If so, what kinds of insights are you pulling into Facebook Analytics? Let us know in the comments!


