
With more than 562 million users in 200 countries around the world, LinkedIn is the world’s premier B2B social network. By publishing press releases, thought leadership articles and other news items to your company page, you can firmly establish your business as an authority. But tracking your LinkedIn analytics is essential for working towards this goal.
You’ll be familiar with some social media metrics on LinkedIn, but probably not all of them. Company pages feature some LinkedIn-specific analytics that you’ll want to familiarize yourself with to maximize your success.
Bonus: Download a free guide to discover four time-saving tools to help you grow your LinkedIn network faster. Includes one tool that lets you schedule a week’s worth of LinkedIn updates in just three minutes.
How to use LinkedIn analytics
To access the LinkedIn analytics dashboard, navigate to toolbar at the top of your company page. You’ll see three options:
Company Page
Page is where you update things like your profile picture and banner (check out our guide for more information on building an optimal Company Page).
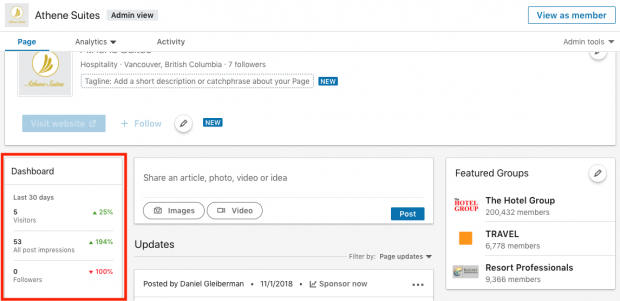
The Company Page has a dashboard showing basic page traffic data from the past 30 days:
- Visitors (how many people navigated to your page, including non-followers)
- Post impressions (how many people viewed your updates on LinkedIn)
- Followers (how many people subscribed to receive your updates)
This information is useful for getting a quick summary of the past month, but it doesn’t display trends over time. To see those, you’ll need to click on the Analytics menu.
Activity dashboard
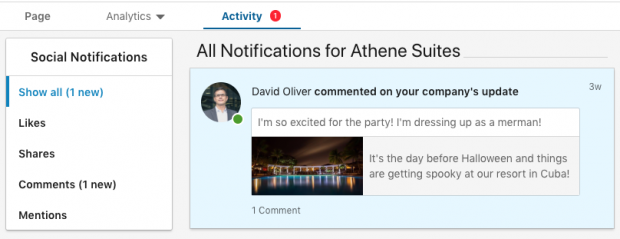
Go to the Activity dashboard for insights on the following metrics:
- Likes
- Shares
- Comments
- Mentions (instances of your brand popping up in conversations online)
Check the Activity page from time to time for qualitative insights into your LinkedIn presence. Reading the comments can help you identify the reasons behind particular data trends.
Analytics dashboard
This is the main area to monitor if you’re looking for deeper insights about your LinkedIn profile. There are three broad data categories:
- Visitors (data on people who visit your page)
- Updates (engagement metrics for content posted on LinkedIn)
- Followers (numerical and demographic information about people who subscribe to your page)
Let’s look at these categories in more detail.
The best LinkedIn metrics to track
Your “best” data in analytics totally depends on the goals you’ve set.
Thinking about hosting a conference in a different city? You may want to check out the Visitors and Subscribers pages to see if your audience is clustered in a particular location.
If you’re experimenting with thought leadership articles, you’ll want to look at Updates. If one article gets above-average interactions, review that piece to figure out why it was so popular.
Let’s check out LinkedIn’s three major analytics categories to learn how all this data can best inform your marketing strategy.
Visitors
Here’s where you can find out who’s visiting your Company Page.
Visitor highlights
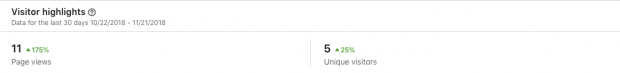
The first analytic you’ll see here is a general overview of Page views and Unique visitors over the past 30 days. Beside each number there’s a percentage showing how much that figure has increased or decreased compared to the same time last month.
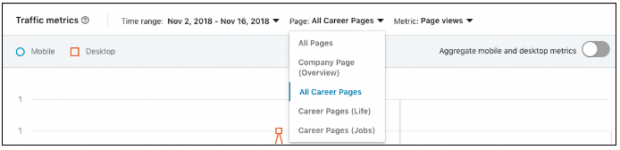
Traffic metrics
By default, this shows your past two weeks of aggregated page traffic data. All the page views from anywhere on your profile are added up and averaged out here.
In the center of the Traffic metrics section you’ll see a line graph representing this data.
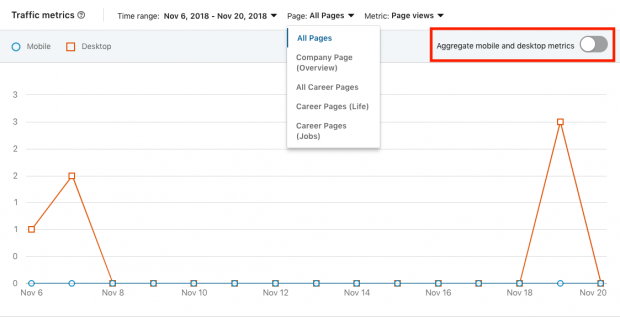
Note that the data here is only accurate up to the previous 24 hours before the last full day. If you’re looking at your traffic metrics at noon on Monday, November 19th, the displayed data will include up to midnight on November 16th.
Traffic metrics graph data is split by device: the blue line represents mobile views while orange is for desktop views. Use the Aggregate mobile and desktop metrics toggle to see the combined results of this data in a single line.
Above this toggle is a toolbar for three data filters: time range, page, and metric.
Time range filter
Pretty straightforward: use this filter to isolate data from a particular date and time.
Page filter
This filter lets you see data from the different pages on your company profile. It offers more granular insights into your page traffic.
Use this data to figure out how to adapt your profile to get more page views—or better yet, increase page views and engagement.
Metric filter
This filter toggles displayed data for Page views and Unique visitors.
Look at Page views when you want to measure the effectiveness of content you’re publishing to LinkedIn. If you’re paying for sponsored content on the platform on a CPM basis, you’ll want to monitor page views to make sure you’re getting a good ROI.
Look at Unique visitors to gauge the size of your audience—how many individual people are visiting your page in a given period?
Higher numbers of unique visitors doesn’t always mean your actual LinkedIn page is successful; it may just mean you have great SEO, or a popular product.
The opposite is also true here: low numbers of unique visitors but high engagement may show that your Page is awesome but serving a niche market.
Visitor demographics
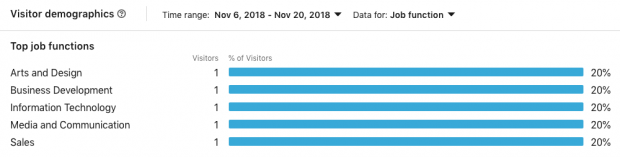
This last section provides detailed information on who’s checking out your LinkedIn company page. You can filter visitors by their:
- Job function (professional niche)
- Location (city and country)
- Seniority (employment rank within a given company)
- Industry (business field)
- Company size (number of employees in the page visitor’s organization)
Knowing your demographics is extremely important for marketing on LinkedIn. Use these analytics to inform your content strategy so you’re reaching the right people, particularly if you’re hiring for a particular role or team.
Let’s say you you’re in the process of hiring more employees but you haven’t had many applicants. You visit your LinkedIn Careers Page analytics to figure out why.
Your first step is going to the Page filter and switching from All Pages to Career Pages (Jobs). Here, you find that the Jobs page is generating a decent amount of traffic… so where are your applicants?
When you switch your view to Career Pages (Life), you scroll down to the Page filter graph and see… nothing!
This lack of data could indicate the source of the problem: people are looking at your job postings, but there’s nothing else on your LinkedIn page to showcase your company culture.
The next step here would be to start building out your Careers pages on LinkedIn—the site reports that people are almost twice as likely to apply if they know the company. One way to close that gap is by sharing relevant updates!
Updates
Data about the content you share on LinkedIn can be found in this section of the Analytics menu. Use this information to gauge the effectiveness of your LinkedIn updates.
For info on how to optimize your update, check out our guide to making the LinkedIn algorithm work for you.
By default, the Updates page shows the aggregated data from all of your content.
Scroll to the bottom of the Updates page to see a list of all the individuals items you’ve shared, organized from most- to least-recent.
Update highlights
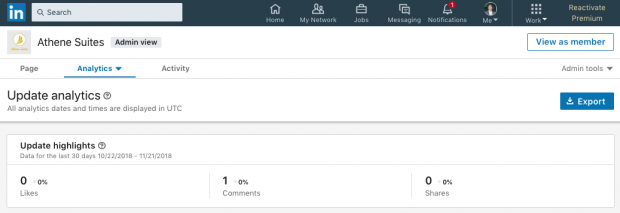
This data measures the previous 30 days of likes, comments, and shares on your page.
As with the visitor updates, you’ll see a number here with a percentage showing how much that figure has increased or decreased since the previous month.
Engagement metrics
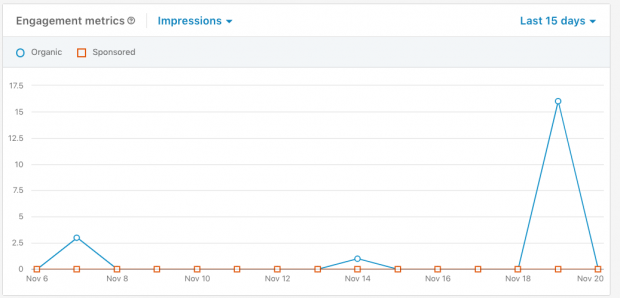
Discover detailed stats on the various types of engagements your content earned in a given time period. You can segment this data by organic or paid traffic (blue and red on the graph, respectively).
Engagement metrics include:
- Impressions (how many times people saw your content (includes revisits)
- Unique impressions (how often individuals saw your content, excluding revisits)
- Clicks
- Likes
- Shares
- Social engagement percentage (# of engaged users * post reach / 100)
Update engagements
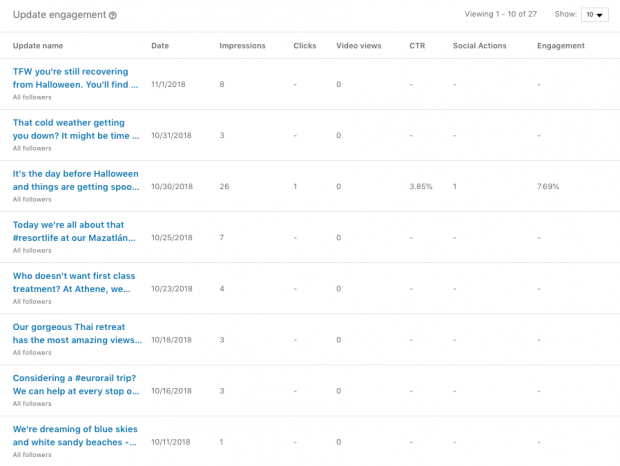
Each item’s individual data is listed in this table. Click the article titles to navigate to them on your Company Page, and read the comments to help you better understand the data.
Followers
Here’s where you find out how successful you’ve been in getting people to follow your Company Page, and learn who those people are.
 Killing it.
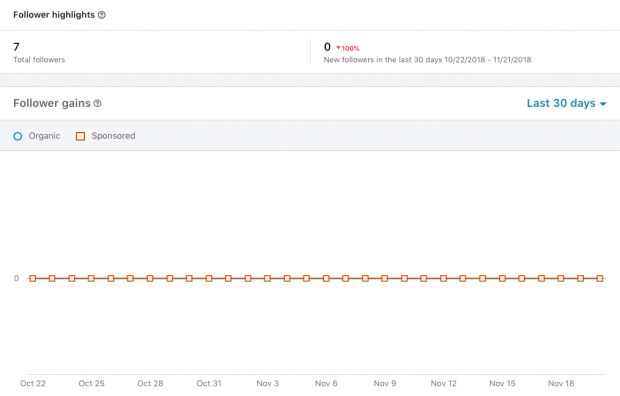
Follower highlights
This quick overview shows your total follower count. It also shows how many followers you’ve gained in the past 30 days, and how that number compares to the previous month.
Follower gains
As the title suggests, this graph maps out your follower growth. By default it shows the last 30 days, but you can select various time periods between one week and one year.
The Follower gains graph tracks two separate metrics: a blue line representing organic traffic, and an orange one for paid traffic.
Again, keep an eye on these to make sure you’re getting a good return on any paid ads and sponsored content.
As with your Traffic metrics, the recorded data only shows up to the previous 24 hours before the last full day.
Follower demographics
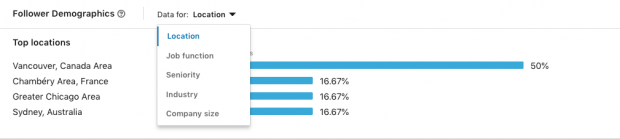
Learn who’s committed to following your page by going through this data. You can toggle between the same categories as visitor demographics (location, job function, seniority, industry, and company size) to see the top 10 of each category.
Compare these demographics to your visitor demographics to see if there’s an underserved category on either side.
Companies to track
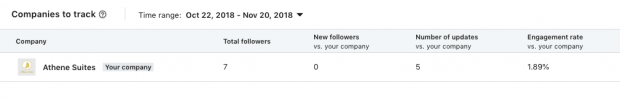
This data shows how your LinkedIn profile compares to similar companies operating in your niche. You can explore the following categories:
- Total followers (compares current subscribers—note that this number is static and won’t change if you update the time range)
- New followers vs. your company (compares subscribers gained)
- Number of updates vs. your company (compares post frequency)
- Engagement rate vs. your company (compares page interactions)
If your page is underperforming compared to a competitor, click on their business, visit their page, and see what they’re doing to win followers and promote engagement.
Companies to track gives you a birds eye view of the whole playing field, allowing you to instantly identify your strongest competition. If they’re killing it on LinkedIn, they’re likely crushing it elsewhere too.
LinkedIn Analytics tools
There’s a fair amount of data available in LinkedIn analytics’ default toolkit, but to truly get the most out of your Company Page, you’ll need to use an external analytics tool.
Hootsuite Analytics
Connecting your LinkedIn account to Hootsuite makes it easier to manage your content and deliver a consistent experience across your social media accounts.
Our social media management platform comes with built-in tools to make managing your LinkedIn account easier. That includes analyzing the data behind your posts, and comparing it to the data on your other social channels.
Hootsuite analytics also allows you to take your social media metrics and turn them into shareable visuals—perfect for case studies and other thought leadership pieces you can then share on LinkedIn.
Brandwatch
Located within the Hootsuite dashboard, Brandwatch is a social listening tool that will zero in on any mention of your company across more than 95 million locations online, including blogs, forums, social networks, news, videos and review sites.
Brandwatch also allows you to dig deeper into your analytics across all your social accounts and compare them with those of your competitors.
The level of granularity Brandwatch’s analytics offer is insane. The platform can analyze the effectiveness of your emoji use, provide data on users sentiments toward your content, and even pick up on instances where your brand logo appears in a photo!
Easily manage your LinkedIn Company Page alongside your other social channels using Hootsuite. From a single platform you can schedule and share content—including video—to engage your network and build your authority on the platform. Try it today.
The post LinkedIn Analytics: The Complete Guide for Marketers appeared first on Hootsuite Social Media Management.


