
What Is Return on Ad Spend (ROAS)?
Return on ad spend (ROAS) is the online advertising equivalent of return on investment (ROI). It’s the cornerstone metric that measures your Facebook advertising success, and whether your marketing dollars are producing positive results for your business or just burning a hole in your bank account.
The 2018 Social Media Marketing Industry Report found that only 10% of respondents strongly agree that they can measure the ROI of their organic social media efforts, with 56% citing they’re uncertain or disagree with that assertion.
However, unlike organic marketing efforts, measuring the ROAS of your Facebook ads is directly linked to your Facebook pixel and conversion tracking. When installed correctly and depending on your business, you get direct, hard data so you know exactly how well your ads are performing and the overall impact of your Facebook advertising on your business.
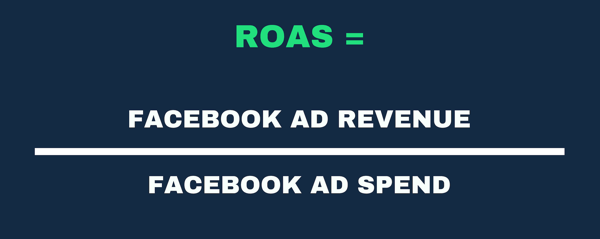
ROAS is simply the total revenue generated from your Facebook ads (your return) divided by your total ad spend. For instance, suppose you spend $50,000 dollars in a month on Facebook ads and they generate $150,000 in new sales for your business. That’s a 3X ROAS ($150,000/$50,000).
There is less ambiguity with Facebook advertising compared to organic social media marketing, which is why it’s such a powerful marketing channel. You can track your ROAS down to the penny by measuring how much you put in (ad spend) and how much you get out (new revenue).
Measuring ROAS for Your Business Type
The businesses that advertise on Facebook can be divided into two main categories:
- Businesses that sell a product or service online that customers pay for immediately on their website
- Service providers that generate leads and convert potential customers off of Facebook via phone or email communication channels
If your business is in the first bucket, measuring your ROAS is easier because it will be tracked directly by your Facebook pixel and the purchase conversion event. However, if you’re a service-based business generating leads and converting off of Facebook, it’s harder to measure your ROAS due to a tracking gap. You have to track the leads that convert and manually cross-match them with your Facebook data.
Now let’s look at how to measure ROAS for both types of businesses, as well as address some of the wider issues with ROAS measurement.
#1: Set Up Facebook Pixel and Conversion Tracking
Before you can measure your ROAS, you need to set up and install the Facebook pixel on your website, as well as any relevant conversion events.
![]()
If you’re an eCommerce business using Facebook to generate product sales, you need to have the eCommerce event actions set up which include add to cart, initiate checkout, and purchase. However, if you’re a service business generating leads, you want to have the lead event action installed.
To install the Facebook pixel and other relevant conversion events, check out this step-by-step guide. Once you’ve installed the pixel on your website and your events, check that they’re firing correctly. The easiest way to do this is to navigate to your pixel dashboard via the Ads Manager main menu.
![]()
Next, select your pixel and open the full dashboard. Under the graph view, you’ll see the event actions that are firing, along with the status of each event and the number of events received. If they’ve been installed correctly, the status column should say Active and when the event was last received.
![]()
For any events that aren’t firing correctly and show Inactive in the status column, click the diagnostics option above the graph view to see any issues with your pixel and event installation.
Ensure the Purchase Value Is Being Tracked by Your Pixel
If your business uses the purchase event to track sales, measuring ROAS effectively requires you to track the value of the purchases from Facebook, not just the volume of purchases.
To check that the value of orders is being sent via the pixel to your ad account, click View Details under the Purchase event action.
Then in the pop-out window under Parameter, look for the value parameter and number of items parameter, along with content IDs and currency.
![]()
#2: Create a Custom Reporting Column in Facebook Ads Manager
Once the pixel and event actions are set up, you want to create a custom reporting column that displays key metrics including the number of purchases, the conversion value of those purchases, and the return on ad spend.
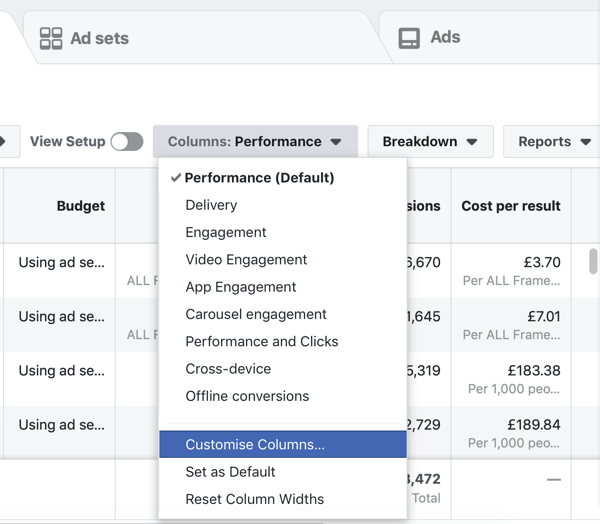
To do this, navigate to your Ads Manager dashboard. Then click the Columns: Performance drop-down menu and select Customize Columns.
The reporting creation window then appears. It consists of three columns. On the far left are the metrics categories, in the middle are all of the metrics you can report, and on the far right are the specific metrics in your custom reporting column.
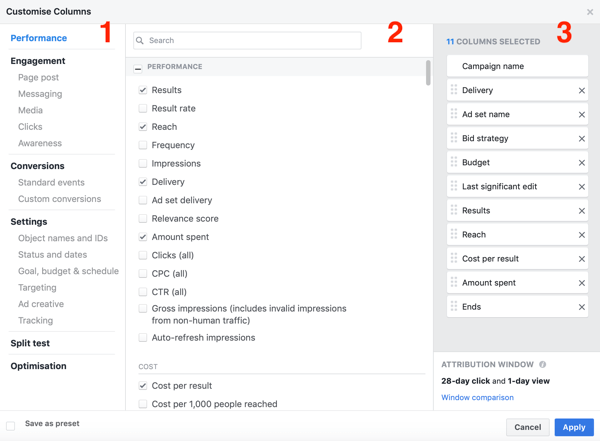
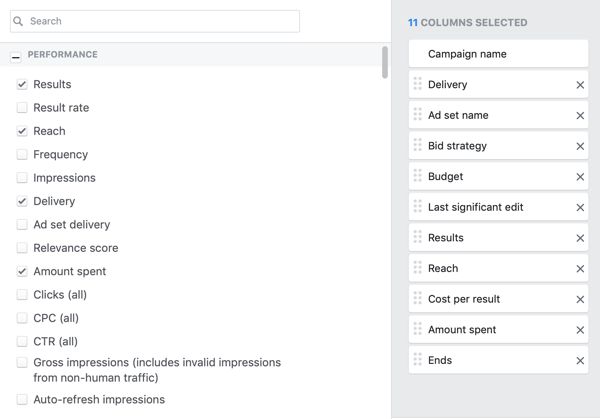
First, you want to remove the unwanted metrics that are currently in the reporting column. In the far-right column, remove all but these 11 core metrics:
- Campaign Name
- Delivery
- Ad Set Name
- Bid Strategy
- Budget
- Last Significant Edit
- Results
- Reach
- Cost per Result
- Amount Spent
- Ends
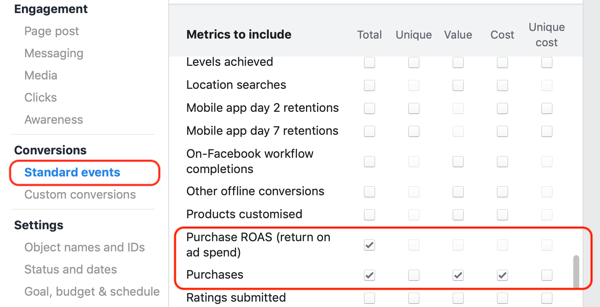
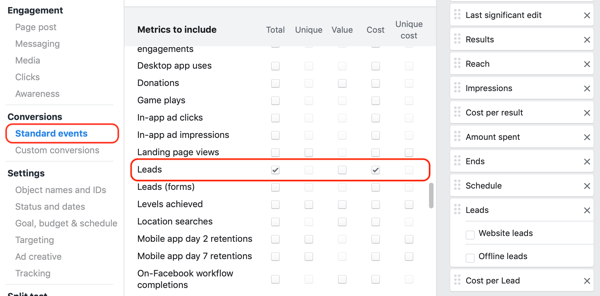
Next, you’re going to add in the purchases, conversion value, and ROAS metrics. In the categories section in the left column, select Standard Events under Conversions.
In the middle column, you’ll see a row for each of the standard event actions. Scroll down to the Purchase ROAS row and select the Total checkbox. Then in the Purchases row, select the checkboxes for Total, Cost, and Value.
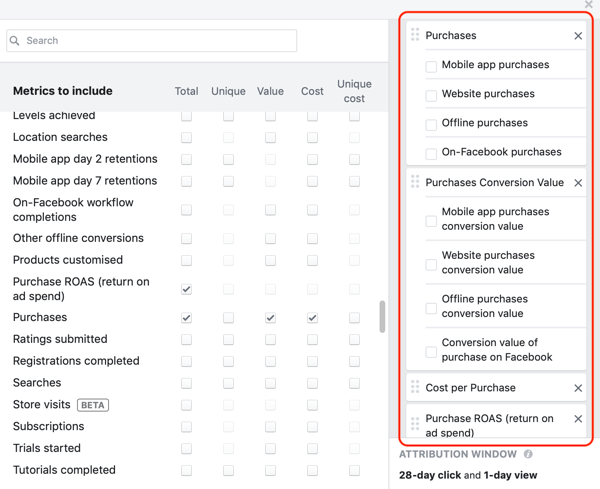
When you select these metrics, Ads Manager adds them to your custom reporting column on the far right. Scroll down to the bottom of that column to edit the segments. In the total purchase field, you’ll see a breakdown of these metrics by purchase type such as mobile app, website, and offline (which are all selected).
If you’re only tracking purchases from your website and not from a mobile app, offline, or through a Facebook store, deselect all of the boxes that are ticked including website purchases. This may seem counterintuitive, but you just want the total purchase value, not the segmented data.
Do the same for the purchases conversion value metric and the purchase ROAS metric. You should be left with a custom reporting column that includes:
- Campaign Name
- Delivery
- Ad Set Name
- Bid Strategy
- Budget
- Last Significant Edit
- Results
- Reach
- Cost per Result
- Amount Spent
- Ends
- Website Purchases (no segmenting)
- Cost per Purchase
- Purchases Conversion Value (no segmenting)
- Website Purchase ROAS (no segmenting)
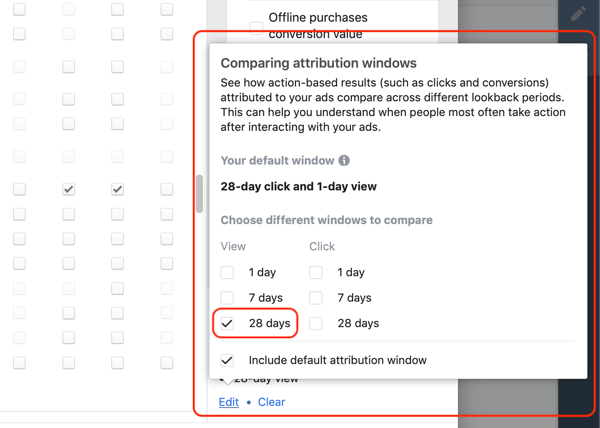
Finally, you want to set your reporting window. The attribution window of 28-day click and 1-day view is selected by default. However, to get a true picture of how your campaigns and ads are performing, you want to add the 28-day view window as well.
Select Window Comparison in the bottom-right corner of the custom reporting creation window. Then select the checkbox next to 28 Days under the View column.
The last thing to do is to click Save as Preset in the lower-left corner, give your custom reporting column a name (such as “ROAS”), and click Apply.
#3: Determine Your Facebook ROAS for Purchases
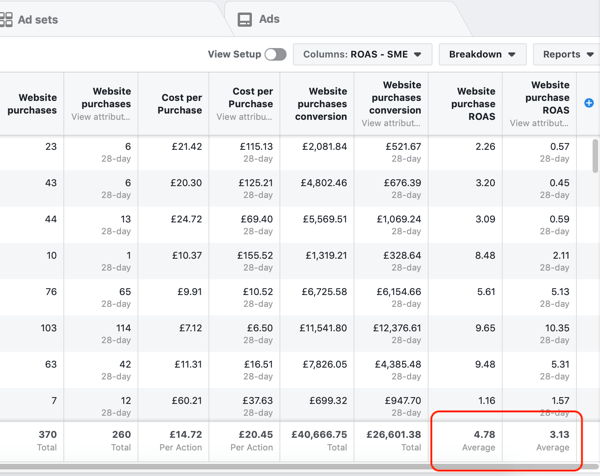
Now you want to analyze the Purchase and ROAS metrics in your new reporting column. You’ll see two columns for each metric. The first column shows the results for the default attribution window: 28-day click and 1-day view. The second shows the 28-day view results.
With ROAS analysis, you first want to get a broader measure of how your overall Facebook advertising is performing and what return you’re seeing. To analyze this, set your date range via the date picker in the top-right corner. What date range you set depends on how deep into Facebook advertising you are.
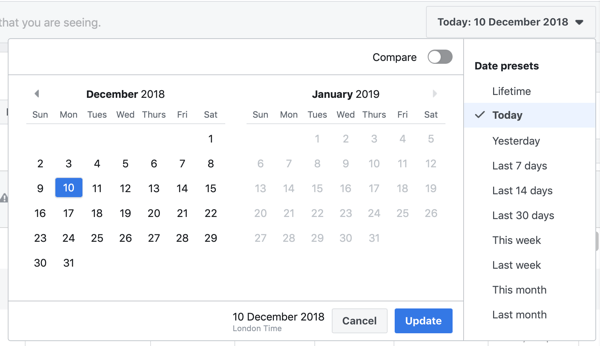
If you’re just starting out, select Lifetime. But if you’re already spending five or six figures per month on Facebook, choose Last Month to do a monthly ROAS analysis.
Next, look at your totals row and add together your two ROAS figures to get your total ROAS across both data views. Your ROAS will be expressed as a decimal such as 3.7. That means that across all of your campaigns in your given time period you generated a 3.7X return on your ad spend.
If you’re a bit of a data nerd like me, you can also work it out by adding the totals of your purchase conversion value together to get the total revenue generated. Then divide that by your ad spend to get your ROAS.
#4: Measure Facebook ROAS for Lead Generation
If your business falls into the second bucket mentioned earlier and you’re using Facebook to generate leads, measuring your ROAS isn’t as easy. It starts the same way as the method above—you need the pixel installed on your website, as well as standard events set up.
Instead of purchase and eCommerce events, you want to set up the lead conversion event for contact points on your website such as your contact form confirmation and any lead magnets you’re using to get people on your email list.
Using the same method of building a custom reporting column detailed in step 2 above, create a reporting column with the lead event action and any custom conversions you created for steps along your lead funnel.
Now for each of your leads that has successfully become a new customer or client, trace what marketing channel that new customer came through and how much they’re worth to your business.
To do this, first look at your CRM or email marketing software to see when they were added to your list. Then cross-reference that with your Facebook advertising at the time by looking at the lead custom reporting column you just created.
Analyze Specific Facebook Campaign Performance
After you’ve analyzed the overall impact of your Facebook advertising, you can then look at the ROAS of your individual campaigns.
Click the first ROAS column to sort your campaigns by the highest ROAS. This makes it easy to highlight both your most effective and weakest campaigns.
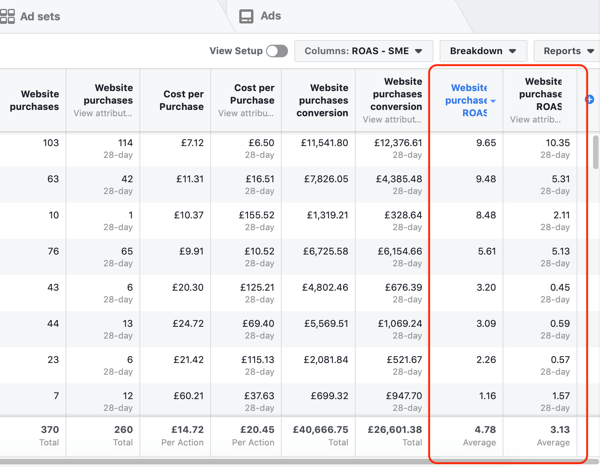
With the highest-generating ROAS campaigns, you can look to scale the ad set budgets to generate more purchases.
It’s worth noting, however, that when you scale your ad spend, your cost per purchase will increase. Additionally, your immediate ROAS will decrease as you start to reach more people in your target audience who aren’t hyper-responsive or the low-hanging fruit that Facebook will have shown your ads to when you started with lower budgets.
For campaigns that aren’t ROAS-positive (meaning your total ROAS is less than 1), you can dive deeper into your ad sets and ads by analyzing the cost, relevance, frequency, and CPM metrics.
When you do this, you can identify why they’re not delivering results and what changes you need to make to get their performance back on track such as improving your audience targeting.
Conclusion
The biggest issue with how you can currently measure your return on ad spend on Facebook (using the Purchase ROAS metric) is that it reports only the immediate purchase value at that specific moment in time when you assess the data.
The key to accurately measuring the real impact of your Facebook advertising (and any marketing channel for that matter) is to look at your customer lifetime value, which goes far beyond their first purchase. I call it true ROAS and it’s usually a much higher level of return due to the higher customer lifetime value.
For example, suppose you spend $10,000 in a month on Facebook ads with an average purchase value of $60 and a cost per purchase of $20. Those ads generate 500 purchases (new customers) with a total purchase value of $30,000. That’s a 3X ROAS. Not bad.
However, if your customers spend on average an additional $80 in the next 12 months, the purchase value increases from $60 to $140. When you measure your true ROAS, those 500 new customers were actually worth $70,000 to your business because they each spent $140. Therefore, spending $10,000 to acquire them makes your true ROAS 7X.
When it comes to making ad spend decisions and planning your ad campaigns, don’t just look at your immediate ROAS; instead, calculate your true ROAS. To help you better understand the conversions that happen in your business and how they can be attributed to Facebook as a marketing channel, Facebook has introduced the Attribution tool. Check this guide on how to set up and use the Attribution tool to better understand your data.
Measuring Facebook ROAS isn’t as straightforward as it might appear. But by using the purchase ROAS method or the lead method (depending on your business), you can assess the immediate return that your Facebook advertising is generating for your business.
If you use the Attribution tool alongside these methods and factor in your customer lifetime value, you can fully understand the true long-term impact of your Facebook advertising on your business.
What do you think? Have you used this method of measuring Facebook ROAS to assess the effectiveness of your campaigns? Please share your thoughts in the comments below.


